 Infographics are the new “thing” as far as web graphics are concerned. There are many floating around on the internet and it’s amazing how much you can learn by looking through one (if they are good). Also, much of the posts that I will make on here will usually involve a map in some way – like the example below.
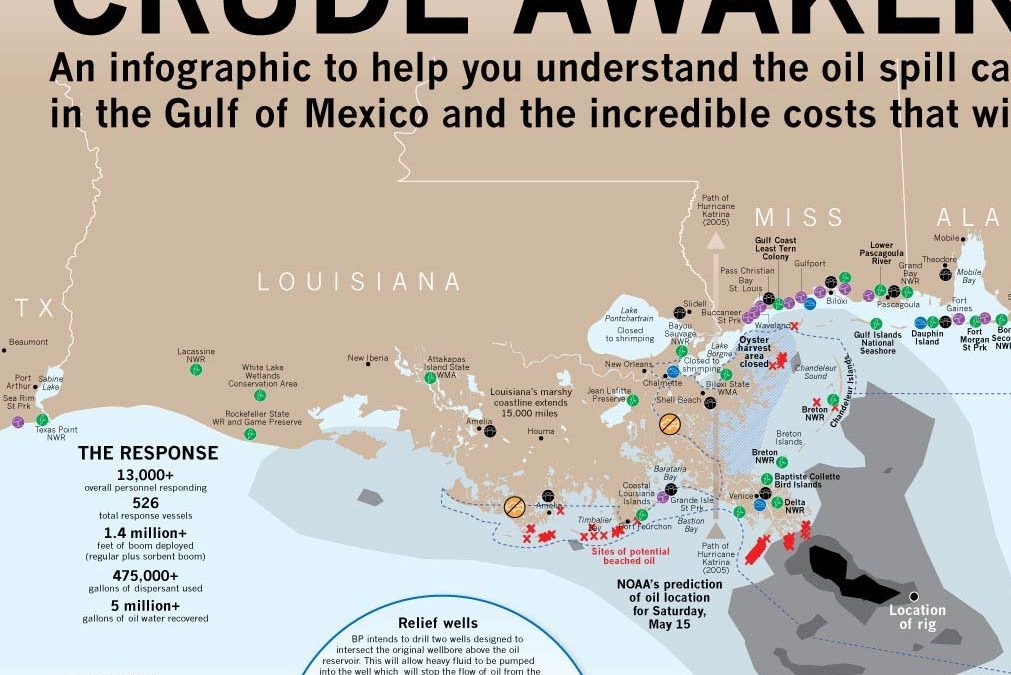
Here is an example… “Crude Awakening” is an infographic with a decent map of the oil spill as of May 13th. Even though it’s a bit outdated it is still worth a visit. You can click on the image to visit the full image.
This one is from ZM Graphics posted at InfoGraphicWorld.com
Recent Comments