by Chris | Nov 16, 2012 | Geospatial, Science
I made this map in response to the choropleth maps that have been floating around that don’t quite reflect voting populations in the US. This map is rendered based on population density by county and labeled according to RED or BLUE. Soon I will post another map...

by Chris | Oct 1, 2011 | Geospatial
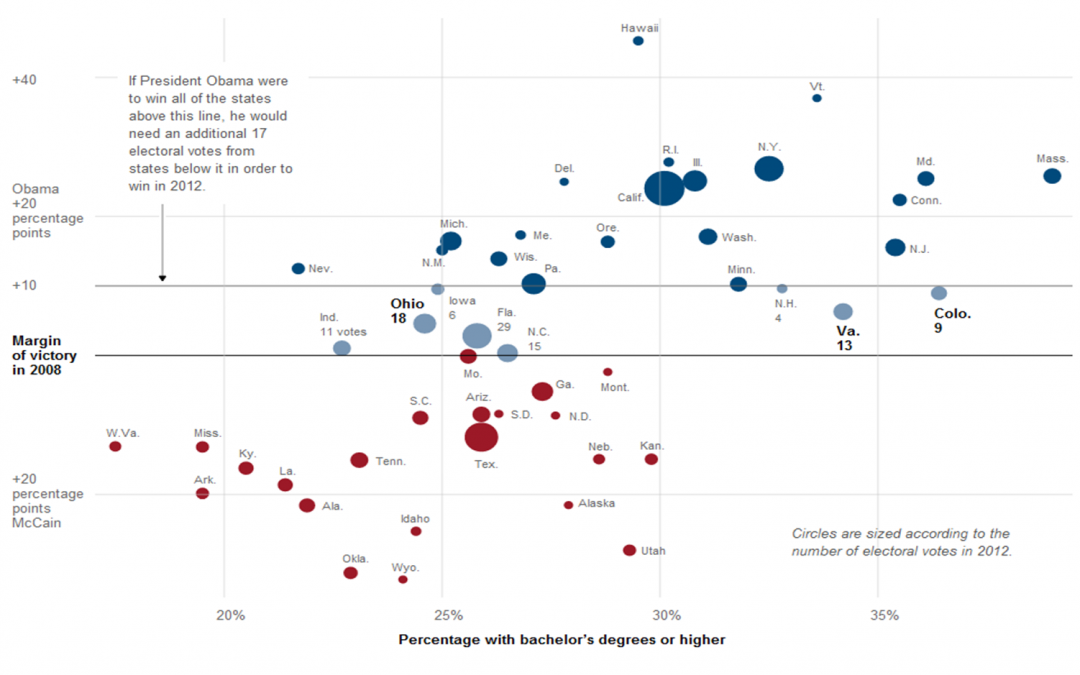
The NYTimes has just released a chart placing all electoral votes from 2008 within their respective Dem or Rep positions. The chart also displays these perspectives with regard to % of Bachelor’s Degrees per state. Interestingly, the states with the most...

by Chris | Aug 3, 2011 | Geospatial
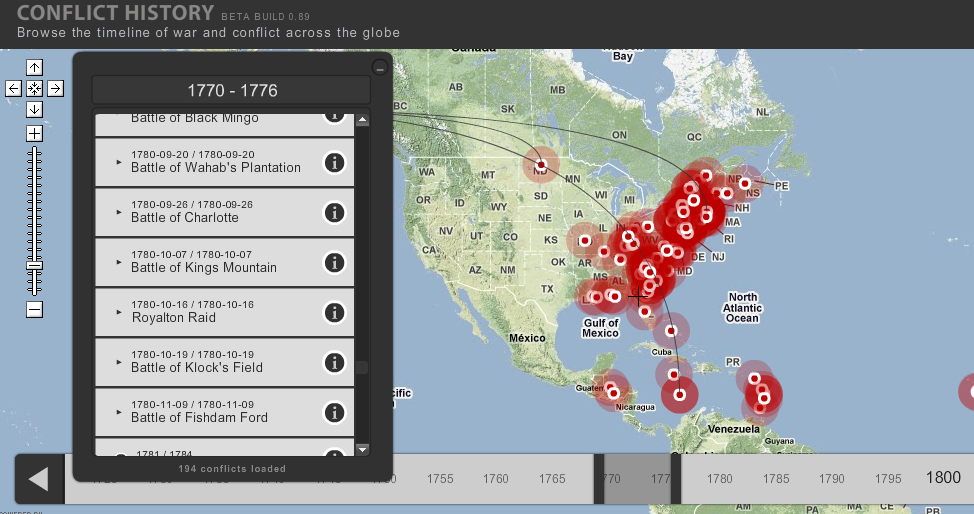
When teaching history, one quickly discovers that good maps are hard to find that illustrate many of the aspects you are trying to teach. A new website, Conflict History, takes all known battles, small and large, and places them in a user-friendly timeline linked to...

by Chris | Feb 15, 2011 | Featured, Geospatial, Science
As the budget debate heats up in Washington between the White House and the Republican majority in the House of Representatives, many are concerned about tough to decide changes that are certainly coming. In the most recent newsletter published by the Association of...

by Chris | Jul 28, 2010 | Geospatial
Type Brewer is a font / typography tool that assists non-cartographers and typical mapmakers in selecting font types. It uses visual selections to help you find exactly what you are looking for. Although this is no substitute for real typography, it will help you make...

by Chris | Jul 22, 2010 | Featured, Geospatial
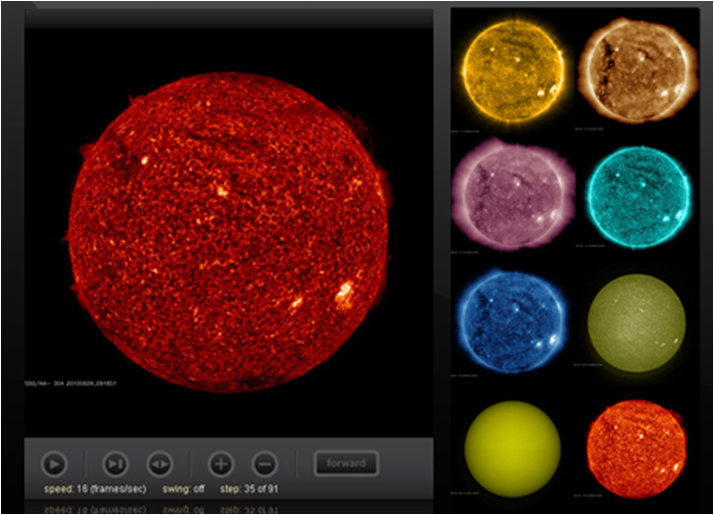
The brand new Solar Dynamics Observatory website allows for amazing telescopic views of the sun. You can specify your specific dates that you wish to see the sun’s activity and you can receive an output of images or videos. Also, you can choose a specific...


Recent Comments